01—Introduction
Rapid growth in agricultural sales data makes manual processing inefficient and error-prone. This project designs and implements an end-to-end automated ETL pipeline to help a retail company maximize agricultural sales and inventory efficiency through data-driven insights.
The pipeline identifies demand patterns across products, regions, and seasons by leveraging PySpark for scalable processing, Great Expectations for data validation, Airflow for data orchestration, and MongoDB as the final data store.
02—Data Overview
The agricultural sales dataset is sourced from Kaggle and represents structured retail transaction records across multiple agricultural product categories. The data spans the 2022–2023 fiscal years and focuses on agricultural product sales, supply chain activity, and pricing behavior.
It captures item-level information such as product names, categories, prices, quantities sold, revenue, sales dates, and regional attributes. These records are extracted and processed through a structured ETL data pipeline, where raw CSV files are cleaned, validated, and transformed into an analytics-ready tabular format.
The processed data is stored in a centralized database to support key business use cases, including revenue and profit tracking, product inventory management, pricing strategy optimization, and supply chain performance monitoring.
03—Methodology
Pre-automation
Performed EDA on Kaggle dataset to evaluate data quality, analyze numerical distributions, detect outliers, and summarize overall dataset reliability.
Data Processing
Following EDA, data preprocessing was performed using PySpark by handling missing values, standardizing column names, converting data types, capping extreme outliers using Tukey's clipped IQR method.
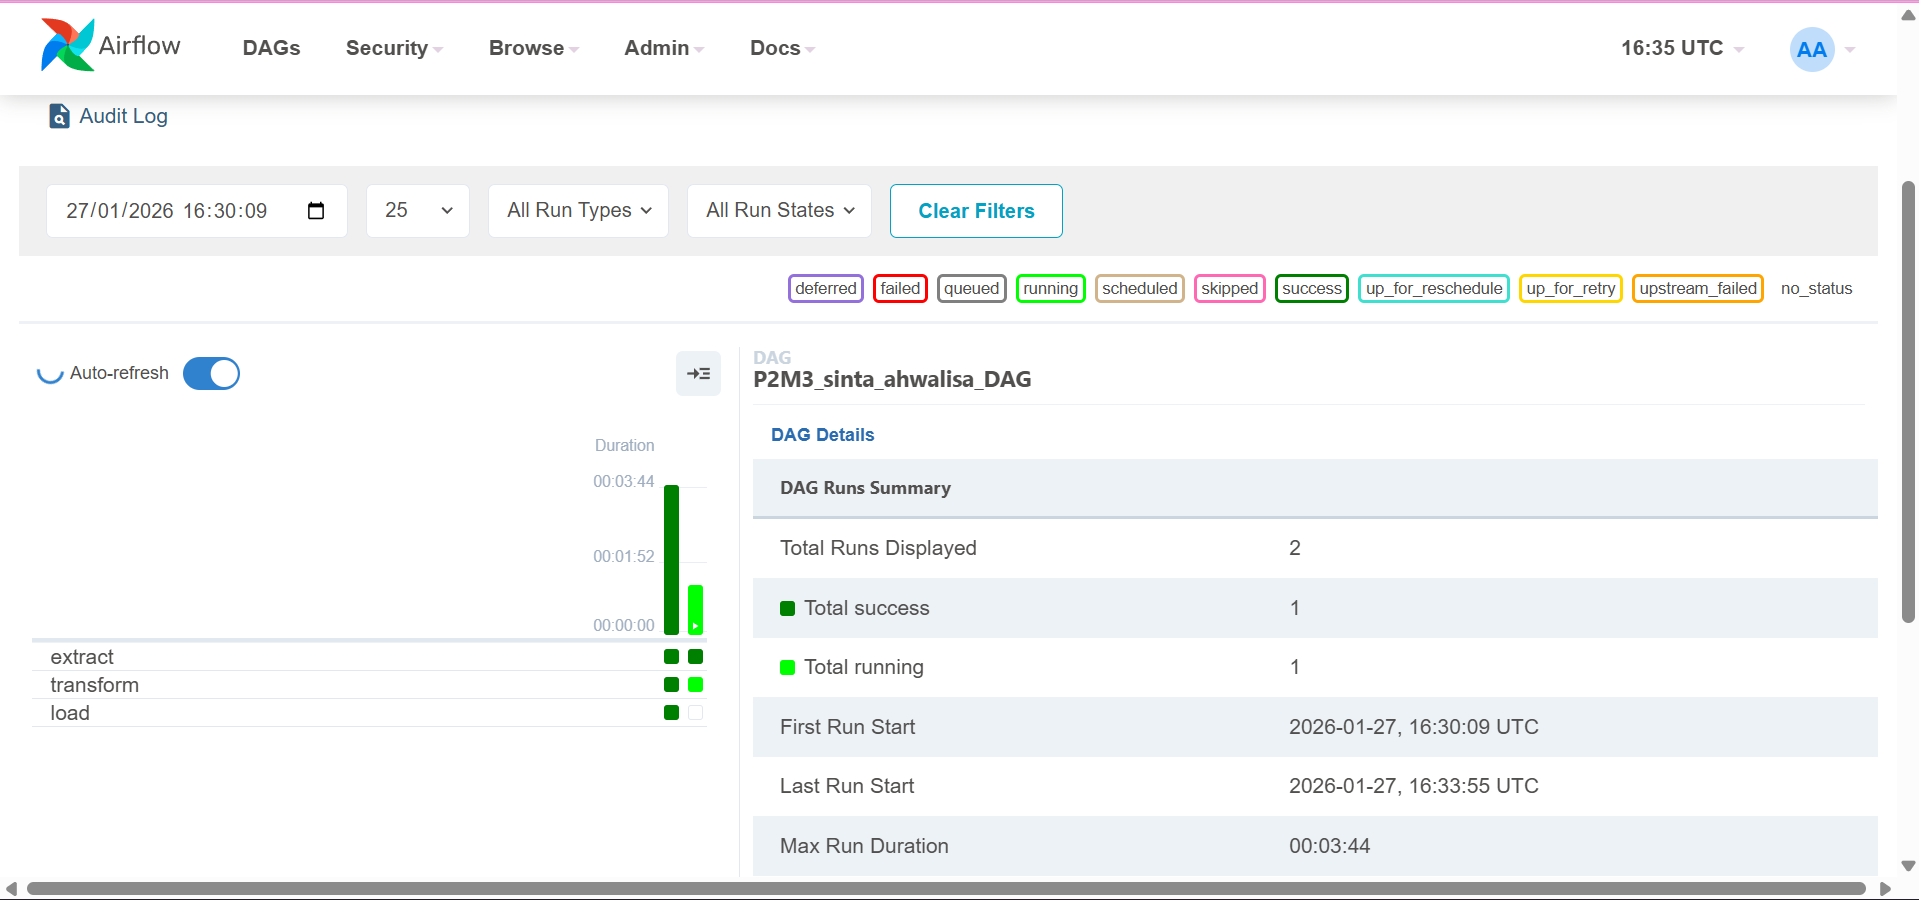
Workflow Orchestration
Data automation was implemented using Apache Airflow by creating a DAG to orchestrate the end-to-end pipeline, executing extract, transform, and load scripts sequentially to ensure reliable and scheduled data processing.
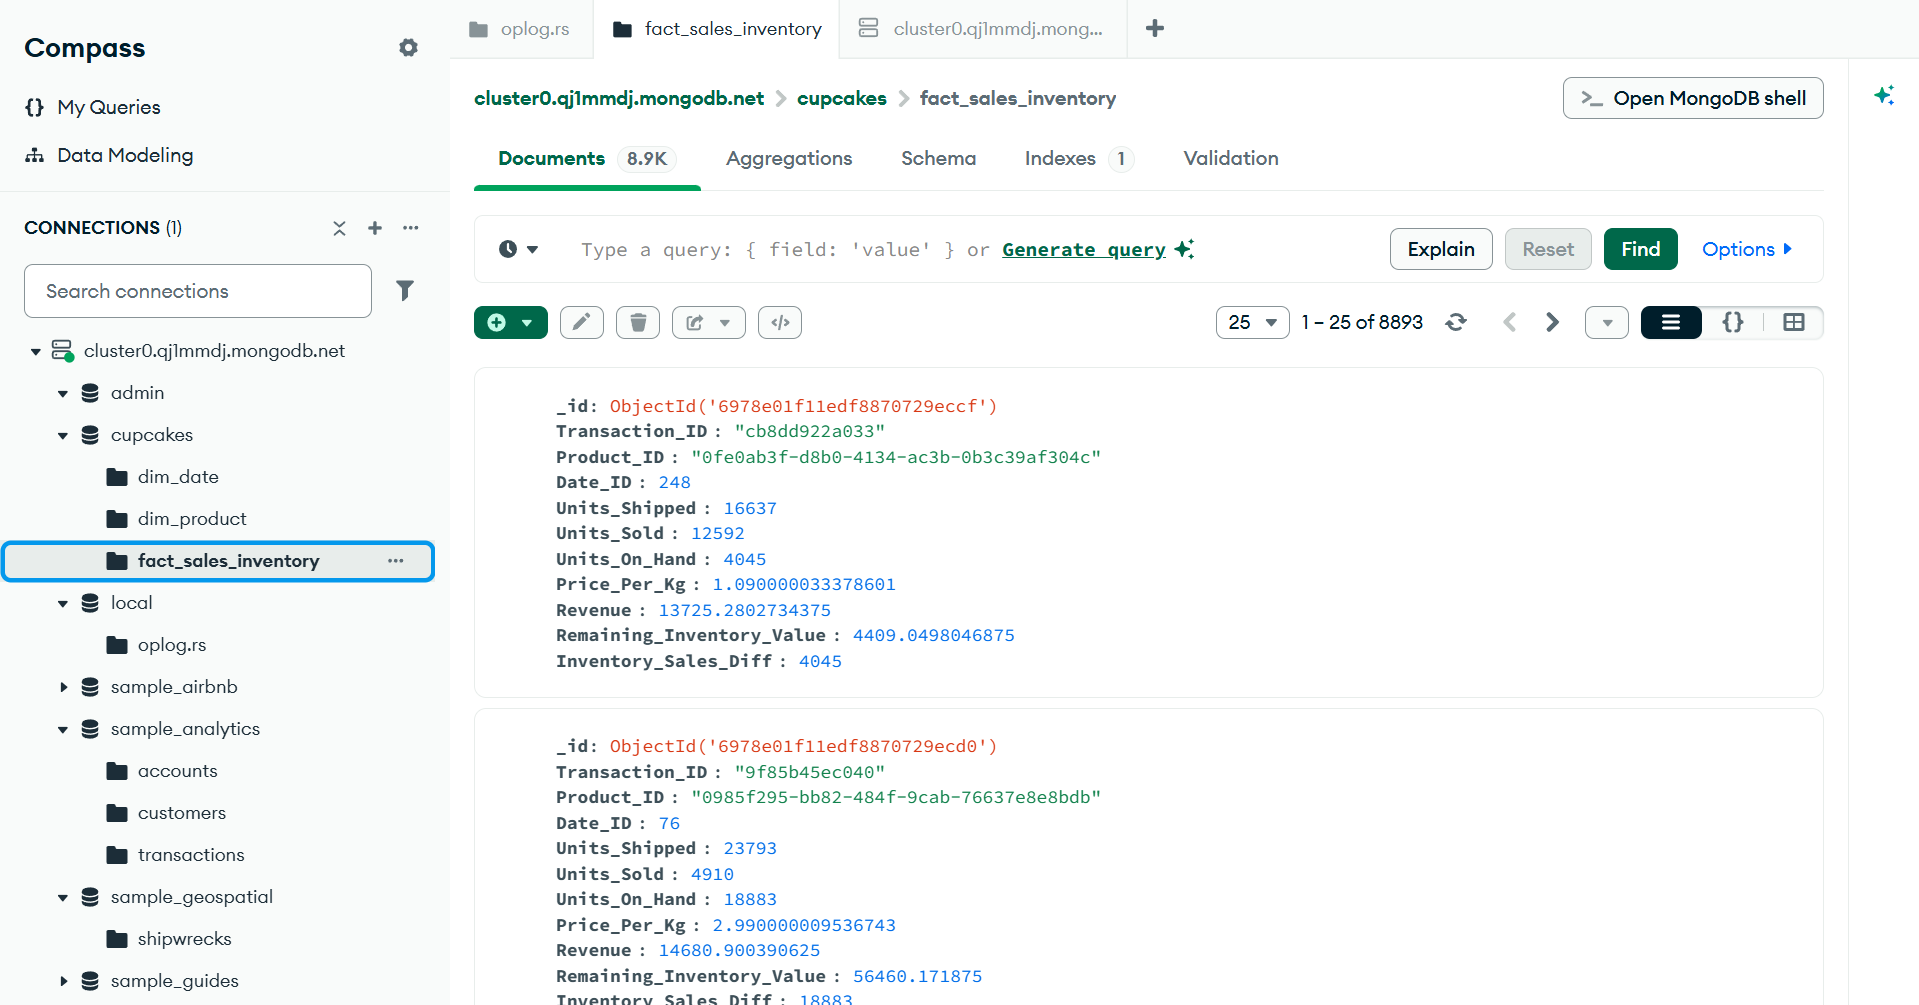
Data Warehousing
For the loading stage, the processed data was stored in MongoDB following a dimensional data model, consisting of dimension tables and one fact table capturing sales transactions.
04—Data Preview
05—Market Insights
Sales & Revenue Performance
1. Top Selling Product
The top-selling product based on total units sold is Beef, with ~6,067,582 units sold, accounting for the highest sales volume among all agricultural products and indicating the strongest market demand. While carrots came up as the lowest-performing product, with ~2,383,370 units sold, indicating comparatively weaker demand relative to other products.
2. Revenue Share
Lamb is the highest revenue-generating product which generated ~69.96 million in revenue, making it the most financially impactful product in the dataset. In contrast, Wheat only generating approximately 2.03 million, indicating limited revenue contribution despite ongoing sales activity.
3. Top Category by Revenue
The top-performing category is Livestock, generating ~183.69 million in revenue and accounting for 44.41% of total agricultural sales, highlighting its dominant role in overall business performance.
Pricing & Demand
Price-Demand Alignment
No product demonstrates a clear high-price but low-demand pattern, suggesting that current pricing levels across products remain relatively aligned with market demand and do not significantly suppress sales volume.
Inventory & Supply Chain
1. Inventory Efficiency
There is no strong evidence of slow-moving inventory where average stock levels consistently exceed sales volume, indicating that inventory levels are generally balanced with demand across products.
2. Best-Performing Supplier
The highest-performing supplier by revenue is Ranchers Pride, generating ~49.76 million, making it the most significant contributor among all suppliers.
3. Best-Performing Farm Location
The top-performing farm location is East Daneborough, TX, generating ~624,034 in revenue and representing the strongest regional performance in the country.
Seasonality Analysis
1. Monthly Sales Trend
The highest sales volume occurred in July, with ~9,764,886 units sold, indicating a strong seasonal demand peak during mid-year.
2. Quarterly Sales Performance
The strongest sales quarter is Q2, generating approximately 106.05 million in revenue and accounting for 25.64% of total annual sales. This suggests peak commercial activity during the second quarter, potentially driven by harvest cycles or increased market demand.
Despite minor fluctuations, units sold across all quarters remain evenly distributed, ranging between ~27.5–28.2 million units, indicating stable demand throughout the year with no extreme seasonal volatility.
06—Conclusion
This agricultural sales dataset reflects a structurally efficient and low-volatility market characterized by inelastic core demand and disciplined operational execution. Revenue concentration in livestock products indicates strong consumer utility and pricing power, while the near-uniform quarterly revenue distribution suggests demand smoothing rather than cyclical dependence, a hallmark of mature retail systems.
The absence of systematic price–volume distortions and excess inventory signals statistically optimal alignment between supply, pricing, and consumption behavior. However, the pronounced asymmetry in supplier and regional contributions reveals latent inefficiencies that represent strategic leverage points rather than systemic risk.
Overall, the data portrays a retail ecosystem that has largely optimized for economic stability, where incremental gains will be driven not by scale, but by precision in portfolio allocation, supplier performance calibration, and marginal efficiency improvements.
07—Libraries & Tools


08—GitHub Repository
Access the complete code and documentation for the Automated ETL Pipeline & Orchestration on GitHub: Visit GitHub Repository