01—Introduction
Business Goal: Detect early fraud signals before financial losses escalate by analyzing statistical interdependencies and behavioral anomalies within transactional ecosystems.
This project addresses a critical challenge in financial services: fraudulent transaction patterns are subtle and complex, often buried in noise and difficult to detect until significant damage has occurred.
1. Challenge
Transaction data is inherently complex and noisy. Fraudulent signals are so subtle that they easily get lost, making early detection nearly impossible without systematic behavioral profiling.
Problem 1: Unusual Spending Patterns
Users exhibit transaction behaviors that deviate significantly from their historical norms.
Problem 2: Merchant Anomalies
Certain merchants show disproportionately high fraud rates, indicating targeted exploitation.
Problem 3: Transaction Time Anomalies
Fraud concentrates during specific time windows when monitoring is reduced.
Problem 4: Delayed Detection Risks
Late fraud detection leads to escalating financial losses and user trust erosion.
2.Solution: Behavioral Profiling & Rule-Based Detection
Alignment with SDG 8 (Decent Work and Economic Growth): This analysis promotes inclusive and sustainable economic growth by ensuring fair access to formal financial systems. By identifying vulnerable user groups and applying targeted fraud controls, we protect legitimate economic activity while minimizing friction for active consumers.
02—Background
The project follows the SMART framework to ensure measurable and actionable outcomes:
Specific
Identify fraudulent activities by analyzing transaction patterns and merchant diversity.
Measurable
Track fraud rate (%), fraud count, and fraud captured per legitimate user.
Achievable
Use structured automated ETL, BI dashboards, and fraud control rules.
Relevant
Support secure and inclusive financial activity, aligning with sustainable economic growth.
Time-bound
Evaluate fraud indicators and adjust fraud control rules on a regular cycle (weekly or monthly).
03—Dataset Overview
The analysis is based on comprehensive credit card transaction data spanning the 2019-2020 fiscal year:
Data Schema: Snowflake Model
The data is structured using a snowflake schema to optimize analytical queries and maintain referential integrity:
📊 Fact Table
fact_transaction: Contains transaction IDs, timestamps, amounts, fraud flags, categories, and foreign keys to dimension tables.
👤 dim_user
User demographics including age, gender, job, and geographic location (linked to dim_city).
💳 dim_card
Credit card information linked to users via user_id foreign key.
🏪 dim_merchant
Merchant details including names, locations (latitude/longitude), and zip codes.
🏙️ dim_city
City-level data including population, linked from dim_user.
📅 dim_date
Comprehensive date dimension with day, week, month, quarter, year, and weekend flags.
04—ETL Pipeline Architecture
Business Goal: Improve operational efficiency through pipeline automation, standardization of definitions/metadata, and facilitate future data scaling requirements.
1. Pipeline Overview
2. Extract
Data Source
Source: credit_card_transactions.csv via KaggleHub API
Method: Download → Copy → Read CSV
Output: Raw CSV ready for transformation
3. Transform
The transformation layer applies systematic data cleaning and feature engineering:
| Step | Description |
|---|---|
| 1. Date Dimension | Generate full calendar with day/month/year attributes |
| 2. City Dimension | Extract unique cities with population data |
| 3. User Dimension | Join with city to get city_id foreign key |
| 4. Merchant Dimension | Remove "fraud_" prefix and deduplicate by name |
| 5. Card Dimension | Link cc_num to user_id via join |
| 6. Fact Table | Join merchant_id and generate date_id |
| 7. Boolean Conversion | is_fraud converted to boolean type |
| 8. Column Renaming | Standardize naming (trx_id, trx_timestamp) |
4. Load
Target Database
Neon PostgreSQL (cloud-hosted)
Load Method
Pandas to_sql() with SQLAlchemy engine
Load Strategy
Batch processing for memory efficiency
Load Order
Parent tables first (city, merchant, date), then child tables (user, card), finally fact table
5. Orchestration with Apache Airflow
The entire pipeline is automated using Apache Airflow with the following configuration:
DAG Name: Final_transaction
Schedule: Every Saturday at 09:10, 09:20, 09:30
Catchup: Disabled (no historical backfill)
Retries: 0 (fail-fast on errors)
Task Pipeline: extract.py → transform.py → validate.py → load.py
05—Data Quality & Validation
Great Expectations applies automated data quality checks to datasets before processing, reducing data integrity risks and improving reliability of transactional insights.
Validation Rules
| Rule | Field | Rationale |
|---|---|---|
| NOT NULL | trx_id | Ensures every transaction can be uniquely identified without missing references. Prevents incomplete records that could cause failures in transaction tracking and reconciliation. |
| NOT NULL | cc_number | Ensures each transaction is linked to a valid payment instrument. Prevents missing payment information that would make financial analysis or fraud detection unreliable. |
| UNIQUE | trx_id | Prevents duplicate transaction records that could inflate transaction counts or monetary values. Maintains accuracy in transaction-level aggregation, reporting, and auditing. |
| TYPE: FLOAT | amt | Ensures the transaction amount can be used safely in mathematical operations such as sums, averages, and trend analysis. Prevents data type errors during financial calculations. |
Impact of Data Quality: By implementing these validation checks early in the pipeline, we prevent downstream analytical errors, ensure reliable fraud detection models, and maintain trust in business metrics.
06—Key Insights: Fraud Behavior Analysis
Question 1: Does fraud occur at the user level or transaction level?
Finding: Out of 983 total users, 762 users (77.52%) are involved in fraud. However, only 7,520 out of 1,296,675 transactions (0.58%) are fraudulent.
Insight: Fraud occurrence is highly concentrated at the user level, suggesting that fraudulent activity is more likely to involve users with repeated transactions rather than isolated, one-off events. Fraud is an extremely rare event at the transaction level, creating a strong class imbalance that requires precision-focused detection strategies.
Question 2: Is fraud a repeated behavior or isolated incidents?
| Metric | Value | Interpretation |
|---|---|---|
| Mean Fraud Count | 9.85 | Average fraudulent user commits ~10 fraud transactions |
| Median Fraud Count | 10 | 50% of fraud users have 10 or fewer fraud cases |
| IQR (25%-75%) | 8-12 | Central 50% of fraud users commit 8-12 frauds |
| Range | 2-19 | All fraudulent users show repeated behavior (minimum 2) |
| Coefficient of Variation | ~30.1% | Relatively consistent fraud frequency across users |
Key Takeaway: Fraud is habitual, not a one-time event. All fraudulent users exhibit repeated fraud behavior (minimum 2 occurrences, up to 19). This indicates that fraud detection should focus on user-level patterns rather than single transactions.
Question 3: Does higher transaction amount indicate fraud?
| Metric | Non-Fraud ($) | Fraud ($) | Insight |
|---|---|---|---|
| Median | $47.28 | $396.51 | Fraud median ≈ 8× higher |
| Mean | $67.67 | $531.32 | Fraud mean ≈ 7-8× higher |
| P90 | $134.21 | $1,024.60 | Fraud P90 ≈ 7.6× higher |
| Maximum | $28,948.90 | $1,376.04 | Legit max much higher (rare outliers) |
Finding: Fraud transactions are consistently higher in value (median ~$397, mean ~$531) compared to legitimate transactions. However, fraudulent amounts are more tightly bounded (max ~$1,376), suggesting calculated evasion, fraudsters avoid extremely large amounts that might trigger automatic blocking.
Question 4: Are underage users more prone to fraud?
| Age Group | Total Transactions | Total Frauds | Fraud Rate (%) |
|---|---|---|---|
| Underage (≤18) | 21,065 | 137 | 0.65% |
| 19-25 | 123,539 | 758 | 0.61% |
| 26-35 | 299,697 | 1,417 | 0.47% |
| 36-50 | 412,476 | 1,927 | 0.47% |
| 50+ | 439,898 | 3,267 | 0.74% |
Key Finding: Underage users (≤18) show a fraud rate of 0.65%, which is higher than prime working-age groups (26-50) but lower than the 50+ segment. The 50+ group records the highest fraud rate (~0.74%), suggesting increased vulnerability, potentially due to social engineering, scams, or lower digital literacy.
Question 5: At what time of day is fraud rate highest?
Peak Fraud Window: 10:00 PM - 12:00 AM
• At 23:00-23:59 PM, we capture 1,904 fraud cases or ~25.37% of all fraud in the dataset
• By combining the 10-11 PM and 11-12 PM windows, we capture ~51% of total fraud
• Fraud activity is strongly time-dependent, with elevated risk concentrated during late-night hours when transaction monitoring and user oversight may be reduced
Operational Implication: Implementing heightened monitoring, additional verification steps (e.g., OTP), or transaction limits during late-night hours (10 PM - 12 AM) could significantly reduce fraud exposure while minimizing friction for daytime transactions.
07—Conclusion: Key Behavioral Signals of Fraud
The analysis reveals that fraud follows repeatable patterns, enabling early detection through user behavior, transaction value, and transaction timing.
♻️ Habitual, Not a One-Time Event
Fraud cases are driven by repeated user behavior, not isolated incidents. This indicates that fraud detection should focus on user-level patterns rather than single transactions.
💰 Calculated Evasion
Fraud transactions are usually higher in value, but avoid extremely large amounts. This reflects deliberate, risk-aware behavior to avoid triggering automated detection mechanisms.
🌙 The Late-Night Window
Fraud risk is strongly time-dependent. A large share of fraudulent activity occurs during late-night hours (10 PM - 12 AM), indicating specific time windows where monitoring should be strengthened.
🎯 Operational Prioritization
Supporting demographic factors, such as age, help translate these behavioral signals into practical rule-based fraud controls under limited validation capacity.
Bottom Line: By identifying behavioral anomalies repeated fraud patterns, calculated transaction amounts, and time-based risk concentration we can detect fraud signals early and intervene before financial losses escalate.
08—Rule-Based Fraud Detection Strategy
To detect and mitigate fraud efficiently, we recommend a rule-based fraud detection strategy that triggers OTP verification for selected age segments. Given that OTP delivery incurs a cost, the company allocates a fixed budget for OTP usage (assumed at 20% of transactions).
Strategy: OTP verification is applied selectively, prioritizing transaction segments with the highest fraud risk to maximize impact within budget constraints.
Detection Workflow
Rule Performance Comparison
Baseline Fraud Rate: 0.5789% (before any validation rules)
| Rule | Coverage | Actual Fraud Rate | Fraud Reduction | Fraud Uplift |
|---|---|---|---|---|
| Rule 1: Youngest Users (13-30) | ~20.84% | 0.4582% | 0.1207 | 20.85% |
| Rule 2: Oldest Users (61-95) | ~19.65% | 0.4350% | 0.1438 | 24.84% ✓ |
| Rule 3: 10% Young + 10% Old | ~20.25% | 0.4466% | 0.1322 | 22.85% |
Recommended Strategy: Rule 2 (Oldest Users)
Targeting the oldest age segment (61-95) delivers the highest fraud uplift (24.84%)
while covering ~19.65% of transactions, staying within the 20% OTP budget constraint.
This approach optimizes fraud prevention impact per OTP sent.
Important Note: This rule-based approach is designed for immediate implementation with limited resources. For long-term scalability, we recommend evolving toward machine learning models that can learn non-linear patterns and adapt to emerging fraud tactics.
09—Dashboard Preview
Interactive visualizations on fraud detection insights, transaction patterns, and behavioral analytics.
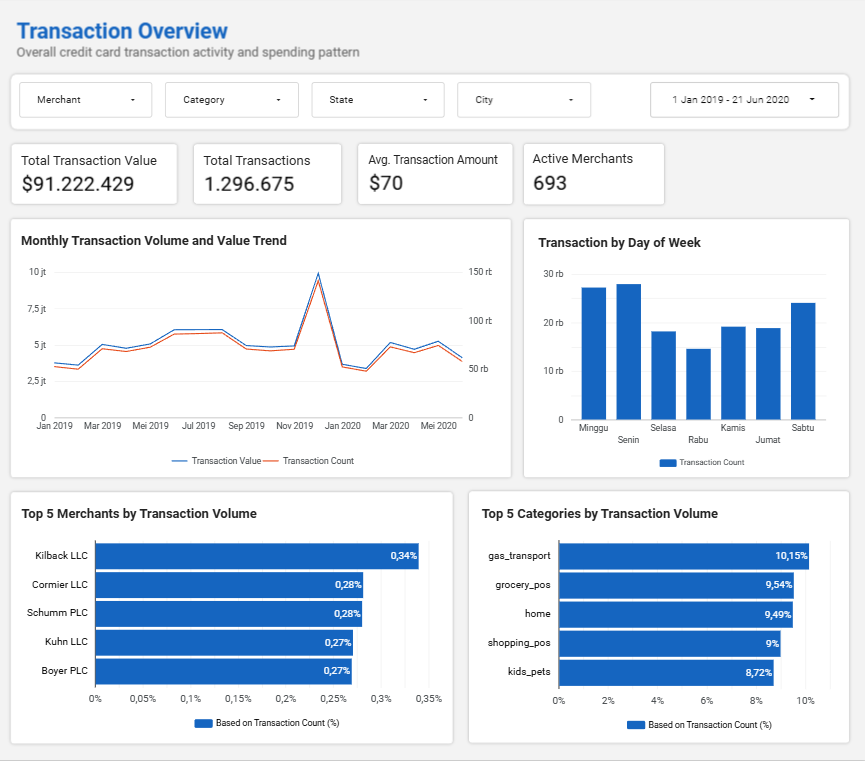
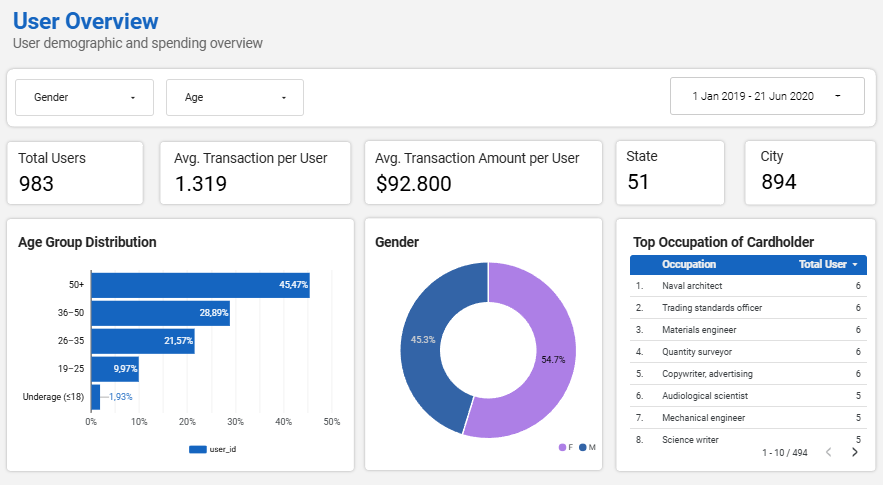
Interactive Looker Dashboard
Explore interactive transaction overview, user demographic, and fraud analysis dashboard in Looker Studio.
10—Recommendations & Next Steps
ACCESS Framework: Bridging Analytics and Decisions for Effective Fraud Control
Next Steps
1. Time-Based Rule Enhancement
Proposed Control: Implement additional OTP verification during 10:00 PM - 12:00 AM window
Expected Impact: Capture ~51% of total fraud with ~10% transaction coverage
2. Multi-Signal Rule Framework
Action: Combine age-based and time-based rules for stronger detection
Benefit: Improve precision and reduce false positives
3. Machine Learning Model Development
Approach: Use rule-based features (age, time, frequency, amount) to train ML models
Goal: Learn non-linear patterns and improve detection scalability
Strategic Progression: These steps establish a clear evolution from explainable rules to a robust fraud detection system that balances interpretability and performance.
11—Libraries & Tools


Technology Stack
| Category | Technology | Purpose |
|---|---|---|
| Data Extraction | KaggleHub API, Pandas | Download and initial data loading |
| Data Processing | PySpark, Pandas | ETL transformations and feature engineering |
| Data Quality | Great Expectations | Automated validation and quality checks |
| Orchestration | Apache Airflow | Pipeline scheduling and automation |
| Data Warehouse | PostgreSQL (Neon) | Cloud-based analytical data storage |
| Visualization | Looker Studio, Python (Matplotlib, Seaborn) | Dashboard creation and exploratory analysis |
| Version Control | GitHub | Code versioning and collaboration |
12—GitHub Repository
Access the complete code, documentation, and analysis for the Credit Card Fraud Detection project on GitHub: Visit GitHub Repository