01—Introduction
By late 2025, churn remained a major challenge for OTT streaming platforms, with subscription video-on-demand services continuing to lose a numerous share of their audience amid intensifying competition and fragmented viewer attention.
Increasingly, subscriber loss was driven not by the lack of available content, but by early disengagement during the viewing journey itself. In a content-saturated environment, small points of friction, such as weak hook, slow pacing, or cognitive overload can drive viewers to stop watching long before a title ends.
This pattern of high viewer drop-off quietly undermines viewer engagement, distorts content performance evaluation, and decreases long-term subscription value seamlessly before users decide to unsubscribe.
02—Data Overview
The dataset used in this analysis is sourced from Kaggle and captures episode-level engagement, behavioral friction, and content design signals from an OTT streaming environment.
It includes key metrics such as average watch percentage, drop-off probability, hook strength, pacing score, cognitive load, episode duration, and viewer behaviors (pause, rewind, skip), providing a comprehensive foundation for analyzing viewer drop-off patterns and retention risk.
03—Methodology
Data Cleaning and Preprocessing
Handling missing values and data duplicates, handling outliers (Tukey + log transformation), correcting data types, and preparing data for analysis.
Exploratory Data Analysis (EDA)
Understanding key patterns, trends, and outliers through statistical summaries and visual exploration.
Data Visualization
Using Tableau for creating interactive visualizations to represent key findings and insights effectively.
Statistical Analysis
Correlation analysis, hypothesis testing, and trend identification are used to determine the key drivers and amplifiers of viewer drop-off.
04—Dashboard Preview
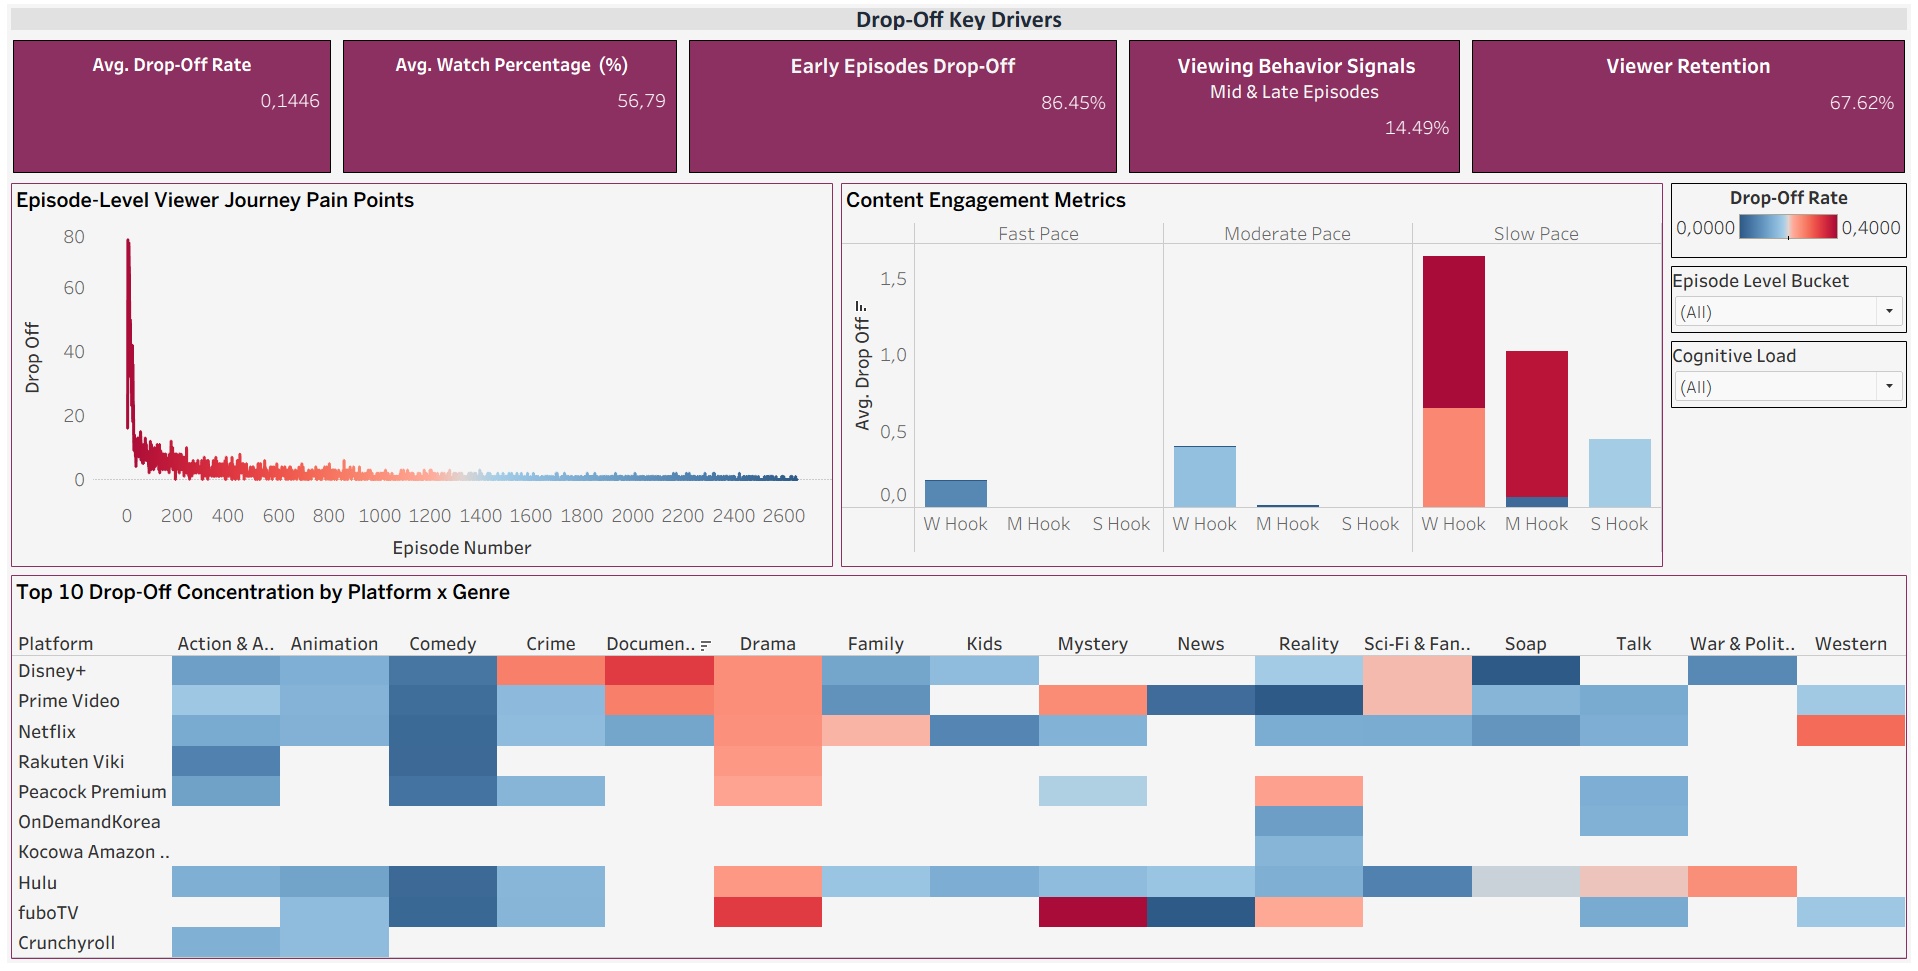
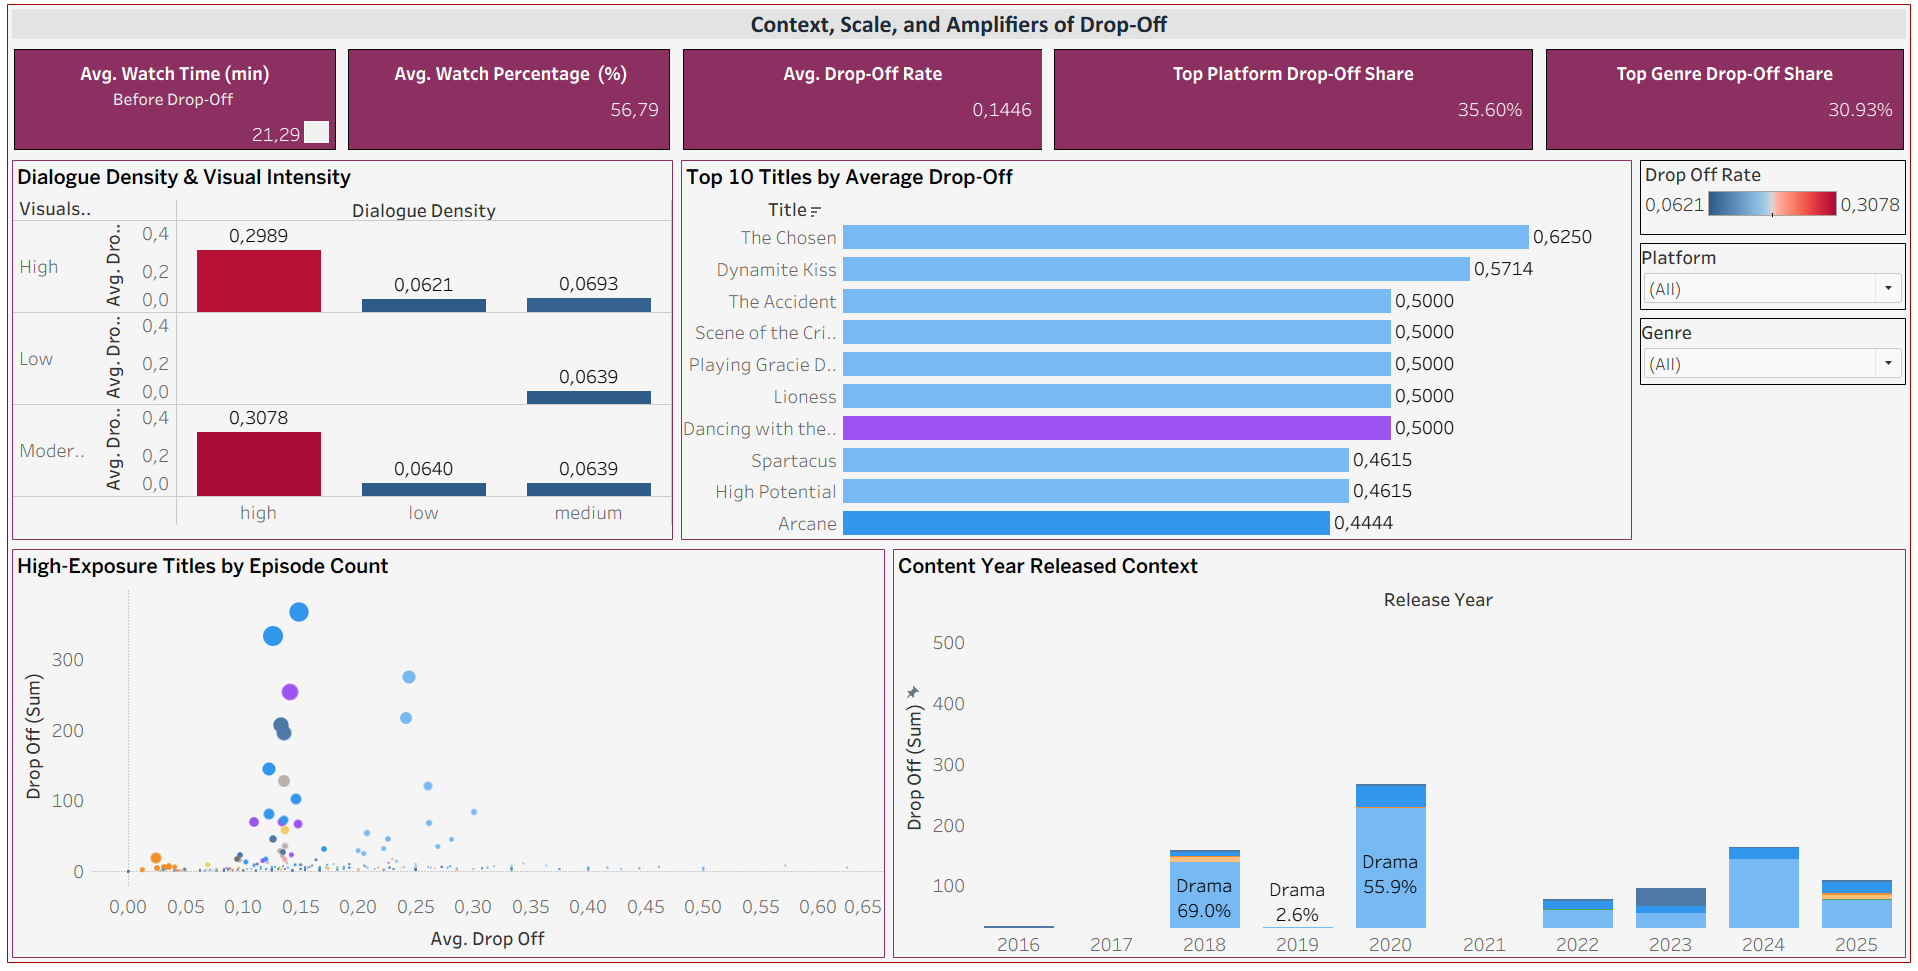
Tableau Dashboard
Explore the interactive visualizations and insights in Tableau here.
05—Conclusion
Viewer drop-off is concentrated in early episodes (86.50%) and is strongly linked to cognitive overload and slow-pacing issues. Viewer churn is not a sudden event, but rather a snowball effect driven by prolonged disengagement.
By identifying when viewers stop watching before completion, OTT platforms can proactively detect churn risk earlier and intervene more effectively along the viewer journey.
Ultimately, shifting the focus from who churned to when and why drop-off occurs enables a proactive retention strategy that protects long-term engagement and subscription value.
06—Recommendations
Priority 1: Identify & Diagnose Early Engagement Declining
1. Optimize Content Pacing
Identify optimal pacing patterns and develop content pacing guidelines to maintain early viewer engagement. Pinpoint exact episode/timestamp of disengagement.
2. Redesign Opening Hooks
Improve opening hooks to capture viewer attention more effectively.
3. Personalized Content Delivery
Right content to the right audience (based on content pace and cognitive load preferences).
Priority 2: Viewers Behavioral
1. Detect Behavioral Friction
Pause ≥ 3x times may indicate boredom in early episodes, while rewind activity peaks around 90% of average watch rate.
2. Flag Exceeding Threshold
Real-time flag abnormal behaviors such as skip intro spikes or declining watch rate (%).
3. Trigger Content Reviews
Initiate content reviews when behavioral friction exceeds defined thresholds.
Priority 3: Genre and Title-Level Optimization
1. Genre Segmentation
Segment 90s animation as a dedicated nostalgic category and identify slow-burn drama titles.
2. Exposure Guidelines
Establish exposure rules for high-visibility titles to prevent early viewer fatigue.
3. Content Balance Framework
Develop a balanced framework for dialogue density and visual intensity across content category.
07—Libraries & Tools


08—GitHub Repository
Access the complete code and documentation for the OTT Viewer Drop-Off Analysis on GitHub: Visit GitHub Repository