01—Project Overview
This analysis examines U.S. consumer shopping data to uncover purchasing patterns, product performance metrics, and customer engagement trends across the retail journey. By leveraging data extraction, transformation, and statistical analysis techniques, this project delivers actionable insights to support market segmentation, merchandising optimization, and customer targeting strategies.
The analysis identifies high-performing product categories, seasonal demand patterns, and customer value segments, providing a data foundation for strategic business decisions in retail operations and marketing.
02—Business Impact
Strategic Value: This analysis enables retail organizations to optimize inventory allocation, improve promotional targeting, and enhance customer lifetime value through data-driven merchandising and segmentation strategies. Insights support revenue growth through better product-market fit and customer acquisition efficiency.
03—Data Overview
The dataset originates from a publicly available consumer behavior study on Kaggle, containing structured transaction-level records across multiple retail categories.
Key Variables: The dataset includes demographic attributes, purchase frequency, average transaction value, product category preferences, seasonal buying patterns, customer satisfaction ratings, and subscription status. These variables enable comprehensive analysis of consumer behavior drivers and purchasing decision factors across diverse customer segments.
Data Scope: The analysis covers retail transactions with sufficient granularity to support SKU-level performance analysis, geographic preference mapping, and customer value segmentation.
04—Analytical Approach
1. Data Preparation
Performed data cleaning, handling missing values and duplicates, standardizing formats, and validating data integrity to ensure analytical reliability.
2. Exploratory Data Analysis
Conducted statistical profiling and pattern discovery across key variables to identify trends, outliers, and relationships between purchasing behaviors and customer attributes.
3. Data Visualization
Designed interactive Power BI dashboards to present key metrics, enable dynamic filtering, and support stakeholder decision-making through clear visual storytelling.
4. Statistical Analysis
Applied descriptive statistics and correlation analysis to quantify relationships between purchase frequency, spending patterns, product preferences, and demographic segments.
05—Dashboard Preview
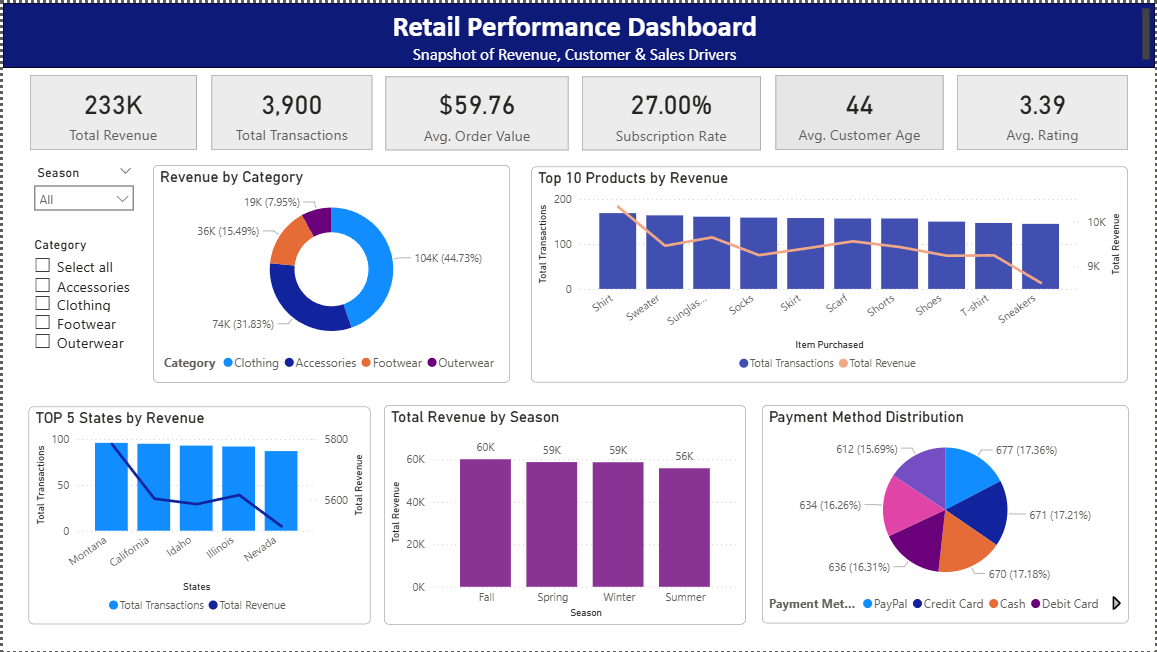
06—Key Data Insights
1. Revenue & Product Category Performance
Total Revenue: $233,081
Analysis of 3,900 transactions reveals robust performance across all product categories with an average order value of $59.76. Clothing leads with $104,264 in total revenue (44.7% of total), followed by Accessories at $74,200 (31.8%), demonstrating strong demand in fashion and complementary products.
2. Category Distribution
Clothing: 1,737 transactions (44.5%) · Accessories: 1,240 transactions (31.8%) · Footwear: 599 transactions (15.4%) · Outerwear: 324 transactions (8.3%) Category concentration indicates strategic opportunities in expanding accessories and footwear lines.
3. Top Revenue Drivers
Top 5 products: Blouses ($10,410), Shirts ($10,332), Dresses ($10,320), Pants ($10,090), and Jewelry ($10,010). These items alone generate $51,162 (22% of total revenue), indicating strong product-market fit and opportunities for inventory optimization.
Seasonal Trends & Geographic Performance
1. Seasonal Revenue Distribution
Fall: $60,018 (25.8%) · Spring: $58,679 (25.2%) · Winter: $58,607 (25.1%) · Summer: $55,777 (23.9%) Revenue is well-balanced across seasons with Fall showing slight advantage. Fall's higher average transaction value ($61.56) suggests premium product purchases during this period.
2. Top Locations by Revenue
Montana leads with $5,784 revenue (96 transactions), followed by Illinois ($5,617), California ($5,605), and Idaho ($5,587). Geographic performance correlates with transaction volume, indicating opportunities for targeted regional marketing campaigns.
3. Regional Strategy Opportunity
Top 10 states account for $53,191 (22.8% of revenue) from just 890 transactions (22.8%). This proportional distribution suggests equitable market coverage with opportunities to increase penetration in high-performing regions through localized product assortments.
Customer Behavior & Engagement Metrics
1. Subscription Performance Gap
Only 27% subscription rate (1,053 of 3,900 customers) despite 43% promo code usage indicates significant untapped potential. The 16-percentage-point gap between promotion engagement and subscription conversion represents a key opportunity for retention programs and membership benefits enhancement.
2. Customer Satisfaction: 3.39/5.0
Average review rating of 3.39 indicates moderate satisfaction with room for improvement. Interestingly, top revenue-generating products maintain similar rating profiles, suggesting that purchase decisions are driven by factors beyond ratings alone, including product availability, pricing, and promotional effectiveness.
3. Purchase Frequency Distribution
Customer base shows diverse engagement patterns: Quarterly/Every 3 Months (29.4%), Annual purchases (14.7%), Weekly (13.8%), and Monthly (14.2%). This diversity indicates need for segmented retention strategies tailored to different customer lifecycle stages and purchase frequencies.
4. Demographics Profile
Customer base skews male (68% vs 32% female) with average age of 44 years (median: 44). Age distribution spans 18-70 years with strong representation across all age cohorts. Gender imbalance suggests opportunities for product diversification or targeted marketing to increase female customer acquisition.
5. Payment Preferences
Payment methods are evenly distributed: PayPal (17.4%), Credit Card (17.2%), Cash (17.2%), Debit Card (16.3%), Venmo (16.3%), Bank Transfer (15.7%). Broad payment acceptance supports customer convenience with no single method dominating, reflecting modern multi-channel payment expectations.
07—Strategic Recommendations
This comprehensive analysis of 3,900 customer transactions totaling $233,081 in revenue reveals actionable insights across product performance, customer behavior, and market dynamics. The findings provide a data-driven foundation for strategic decision-making, revenue optimization, and customer experience enhancement.
Priority Recommendations:
1. Subscription Growth Initiative: With only 27% subscription rate despite 43% promotional engagement, implement targeted conversion programs offering exclusive benefits, early access, and enhanced value propositions to capture the 16-percentage-point opportunity gap.
2. Product Portfolio Optimization: Focus inventory and marketing investment on top 10 products (Blouses, Shirts, Dresses, Pants, Jewelry, Sunglasses, Belts, Scarves, Sweaters, Shorts) which generate 22% of total revenue, while expanding adjacent categories in Accessories and Footwear where transaction volumes suggest untapped potential.
3. Regional Market Expansion: Develop targeted campaigns in top-performing states (Montana, Illinois, California, Idaho) where high transaction values indicate strong market receptivity, while analyzing underperforming regions for market development opportunities.
4. Customer Segmentation Strategy: Create differentiated engagement programs for diverse purchase frequency segments (Weekly, Monthly, Quarterly, Annual) with tailored communication cadence, promotional offers, and product recommendations aligned to customer lifecycle stage.
5. Customer Satisfaction Improvement: Address 3.39/5.0 average rating through targeted quality enhancements, customer feedback analysis, and service improvements to increase retention and lifetime value across the 68% male and 32% female customer base.
08—Tools & Technologies


09—GitHub Repository
Complete code, documentation, and analysis files are available in the GitHub repository: View GitHub Repository